Logging with App Engine and Stackdriver
In days of old, App Engine's logging statement looked something like this:
c := appengine.NewContext(r)
log.Infof(c, "You made a log! Here's a thing: %v", thing)
This appeared in Stackdriver's logging page as a line correctly attributed to the corresponding HTTP request.
And if you call e.g., Warningf, or Errorf, the severity of the request itself is increased to match (to the maximum level of severity you log).
Easy, right? Well, not anymore.
⚠️ While this post uses Go, it applies to all App Engine runtimes. This is especially true as the reason behind App Engine's massive changes is that by removing functionality, more languages are supported 'for free'.
New App Engine
Since the go112 runtime, App Engine, as we knew it for 10+ years, has been effectively deprecated. It's now a place to run a HTTP server with a bit of magic around the edges.
Because of this, you now have a couple of points to consider when logging. For background, remember that App Engine still generates a default HTTP log for every request.
If you simply follow the documentation on how to log for go112 and above, you'll encounter two fundamental issues:
- the logs you generate won't be associated with the current HTTP request
- and, each log event you generate will appear inside Stackdriver on its own line, not grouped together
Of course, you can see these contextless log messages adjacent to incoming HTTP requests, which could be useful for long-lived tasks. But it's now difficult to 'at-a-glance' see logs generated due to a HTTP request in context.
How To Log
For background, to log from user code, you can either:
- Log to stdout (via the built-in log package) or by literally printing to stdout or stderr
- or, log to a named log via Cloud Logging
- Confusingly, the named log you choose can also be named stdout or stderr.
- The name doesn't really matter except that Stackdriver's Log Viewer will show stdout, stderr and your App Engine logs by default.
Additionally, if you print JSON to stdout, it will be treated as a structured log (as if you called Cloud Logging with "stdout" as the log name). This is badly documented, but there are third-party loggers that can help.
Associate Your Logs
App Engine's documentation is vague on how you associate log events with the current HTTP request. Let's go through the steps. To associate your logs with the top-level, default App Engine log for the HTTP request, you'll need to:
- Parse the
X-Cloud-Trace-Contextheader, which include the Trace ID, Span ID and an optional flag - Insert the Trace ID into a string like "projects/<projectName>/traces/<traceId>"
- Use this string as the
Tracefield in a structured log - Ensure you're passing a valid
mrbp.MonitoredResourcethat describes the log asType: "gae_app"
This will ensure that your log is nested with the HTTP request, based on Trace and Type.
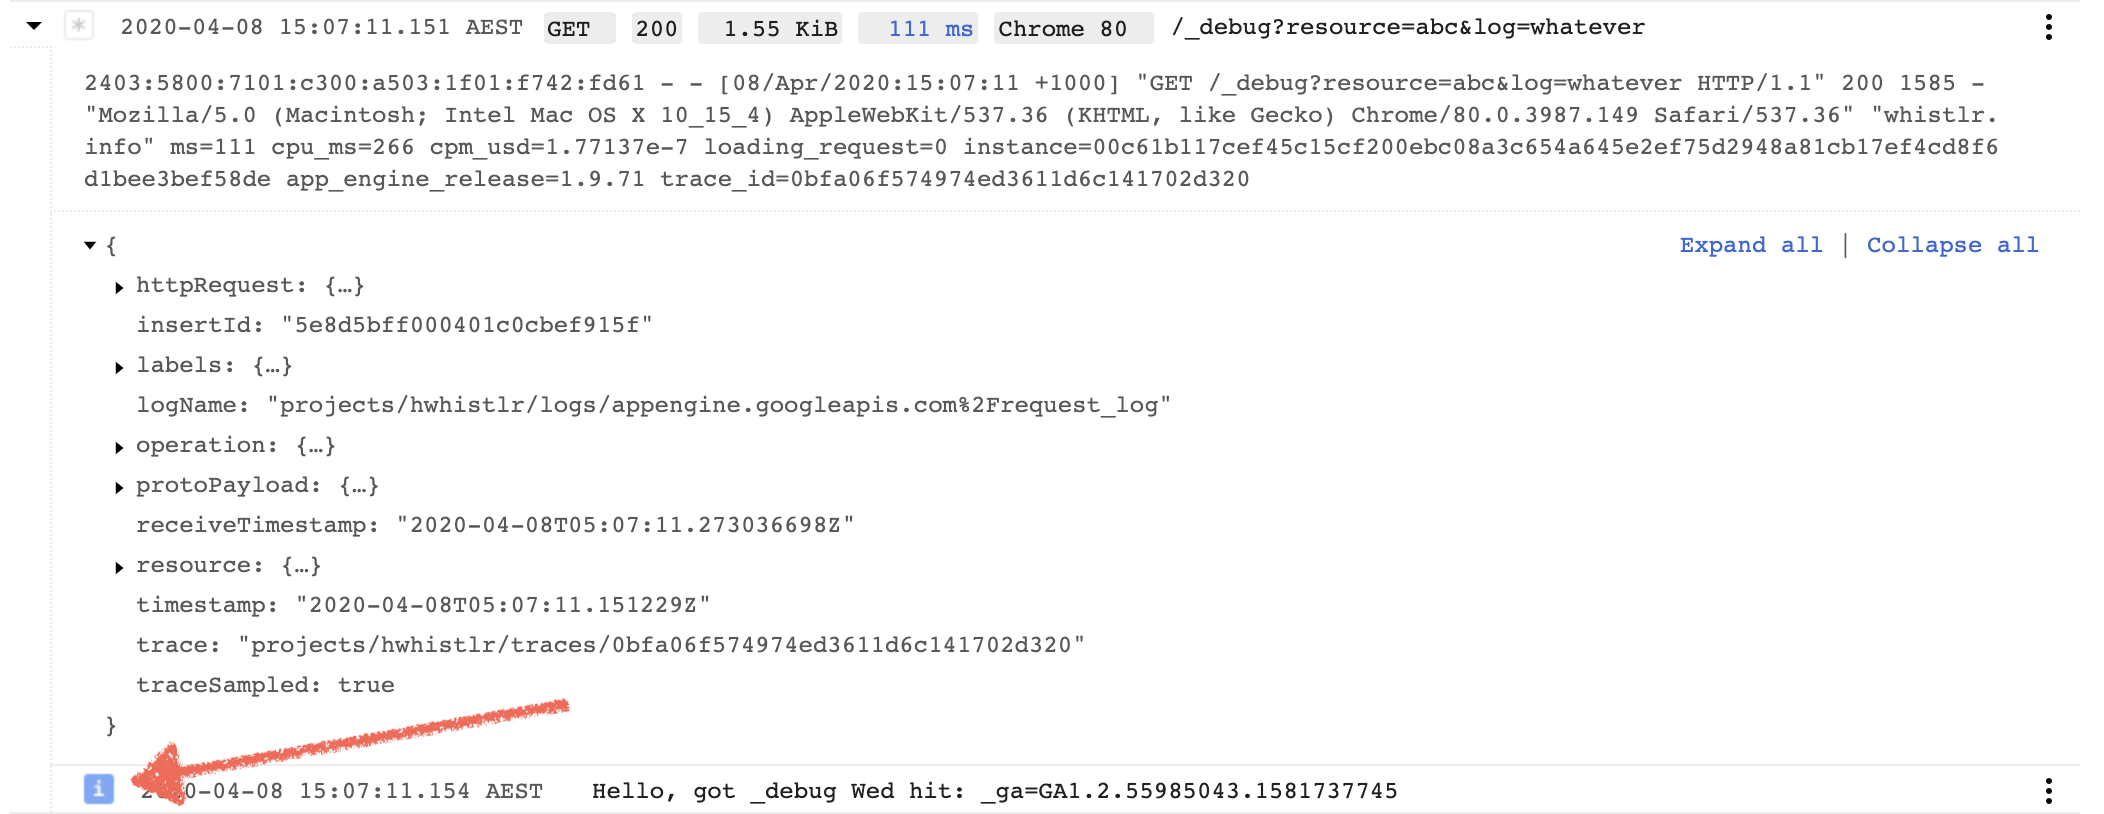
However, this log will still exist at the top-level—it's just being nested by Stackdriver's UI. A simple workaround here is to use a log name that's not shown by default (only stderr, stdout and the App Engine default logs are shown), so it won't clutter your view.
⚠️ You can set the HTTPRequest field of the log entry.
But this will appear as if a whole other HTTP request has occured (as it'll use the structured log format and display "GET", the path, etc) for every individual line you log.
Putting It Together
The code looks roughly like this:
import (
  "fmt"
  "os"
  "strings"
  "cloud.google.com/go/logging"
  mrpb "google.golang.org/genproto/googleapis/api/monitoredres"
)

const (
  projectName = "your-project-name"
  // you can also use os.Getenv("GOOGLE_CLOUD_PROJECT") for this in prod
)

var (
  lg *logging.Logger
)

func init() {
  ctx := context.Background()
  loggingClient, _ := logging.NewClient(ctx, fmt.Sprintf("projects/%s", projectName))
  resource := logging.CommonResource(&mrpb.MonitoredResource{Type: "gae_app"})
  lg := loggingClient.Logger("your-app-appengine-client-log", resource)
}

func httpHandler(w http.ResponseWriter, r *http.Request) {
  traceId := strings.Split(r.Header.Get("X-Cloud-Trace-Context"), "/")[0]

  lg.Log(logging.Entry{
    Trace: fmt.Sprintf("projects/%s/traces/%s", projectName, traceId),
    Payload: "Yes, your log message finally goes here",
    Severity: logging.Info,
  })
  defer lg.Flush()
}
Of course, you probably want to write a helper. Simple. 🤨
Caveats
You can't modify the severity of the default App Engine HTTP log. While this is mentioned in the docs, it's actually an error—there's no way to do this.
You also can't really test this locally, as App Engine no longer runs via the dev_appserver, so no magic headers are provided to you.
Local code just won't see the X-Cloud-Trace-Context header.
A quick way to test if you're in production or not is:
  projectName := os.Getenv("GOOGLE_CLOUD_PROJECT")
  isProd := projectName != ""
Alternatives
App Engine is no longer designed to help you associate simple log output with its default HTTP logging and provide helpful 'at-a-glance' information. So, let's not work against it: another option is to write our own logs.
Parallel To App Engine Logs
As we know, App Engine generates default HTTP logs. They can't be disabled, which means if you insert additional log statements, you might be fooled into thinking that your application has twice the number of requests.
However, if you create logs under a different log name, and aggressively use a different search inside Stackdriver (as you can't set a default), it's possible to see just your own log lines.
You'll need to create two different types of logs.
- The parent log (this maps to the App Engine log we're trying to replicate)
- Any individual log statement (generated from a classic
Logf-style function)
Confusingly, you should create the parent entry last, because it contains information you only know at request completion—e.g., the response size and the request latency. You don't have to specify this data, but Stackdriver will show "undefined" for several fields without it (Stackdriver has a UI for custom fields, but it aggressively tries to include an undocumented number of HTTP-related fields regardless).
As I mentioned before, Stackdriver will associate requests with the same Trace ID. Since we're not logging a real request, you can just make one up. I suggest deriving something from the real ID.
Here's how you might log individual log lines (part 2, above):
res := logging.CommonResource(&mrpb.MonitoredResource{
  Type: "gae_app",
})
fakeTraceID := "_"+r.Header.Get("X-Cloud-Trace-Context") // derived by adding a char
clientLogger, err := loggingClient.Logger("events", res)
err := logger.LogSync(r.Context(), logging.Entry{
  Payload:  "I'm a log message!",
  Severity: logging.Info, // you decide the level
  Trace:    fakeTraceID,
})
Next, you can log information about the whole request (part 1, again, typically after your request is complete):
parentLogger, err := loggingClient.Logger("sane_requests", res)
err := logger.LogSync(r.Context(), logging.Entry{
  HTTPRequest: &logging.HTTPRequest{
    Request:  r,                                   // use incoming *http.Request from http handler
    RemoteIP: r.Header.Get("X-Appengine-User-Ip"), // not in App Engine's *http.Request

    // nb. These can only be found by wrapping your handler.
    ResponseSize: 1234,
    Latency:      time.Millisecond * 1234,
    Status:       200,
  },
  Payload:  payload,         // the top-level payload is totally freeform (JSON or text)
  Severity: logging.Warning, // you decide what this is
  Trace:    fakeTraceID      // from previous example
})
... phew. There's definitely room for a library to help you here, and then as a reminder, you'll have to ask Stackdriver to show you the "sane_requests" log.
Orthogonal to App Engine logs
App Engine is going to continue generating its own logs. Many of these logs are likely completely boring: requests for static assets, redirections, etc.
Rather than trying to replace the built-in behavior, another suggestion is to just create logs for the most interesting of your handlers. You can follow the above guidance to insert HTTP requests but remember that the request is mutable and something you can fake—or even not provide at all.
While I mentioned the list was undocumented (it is), I've observed that Stackdriver will show the following fields in its default view:
httpRequest.requestMethod: usually 'GET' or 'POST', but could be 'FOO'httpRequest.statushttpRequest.responseSize: parsed as byteshttpRequest.latency: parsed as a timehttpRequest.userAgenthttpRequest.remoteIp: only displayed when the log event is expanded
If any of these fields exist, then Stackdriver will try to display all of them. So the choice is up to you: add single text logging events for the progress of your loggable event, and then provide the top-level logger, which can contain a real, fake or no HTTP request.
Troubleshooting
When writing this blogpost, I found that my App Engine's Service Account (in the form appid@appspot.gserviceaccount.com) didn't have permissions to write logs. I think this is because my app is actually quite old–it predates the Cloud Console.

If you see security or other errors, you might need to add the service account to your project (it doesn't always show on the IAM page) and give it "Logs Writer" access.
Parting Thoughts
None of these solutions are ideal. There is an official bug from 2017 which I referenced to write this post. Since this behavior remains the same in early 2020, I don't think there's any plans to simplify logging again.